
Why do some investors seem to steer the turbulent waters of cryptocurrency with confidence while others get swept away by market volatility? The difference often lies in their ability to read the subtle signals hidden within price charts and market trends—a skill that combines both art and science.
Cryptocurrency markets operate on the fundamental principle of supply and demand.
When buyers outnumber sellers, prices climb; when sellers dominate, prices fall.
These shifts create patterns on price charts that, much like weather forecasts, don’t guarantee tomorrow’s conditions but offer valuable probabilities.
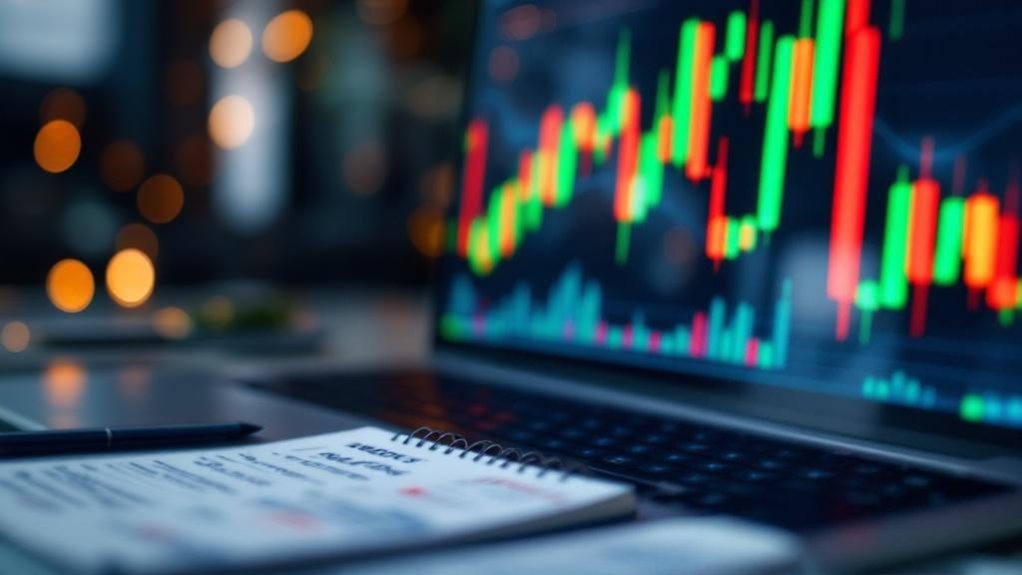
Candlestick charts—those little rectangular blocks with wicks extending upward and downward—tell stories about market sentiment during specific time periods, showing opening prices, closing prices, and the highs and lows in between.
Technical indicators add another layer of insight to these visual narratives.
Technical analysis illuminates market psychology through mathematical patterns, transforming price chaos into decipherable signals for strategic decision-making.
Moving averages smooth out price noise like a rolling fog clearing to reveal the actual landscape beneath.
The Relative Strength Index (RSI) serves as the market’s fever thermometer—readings above 70 suggest an “overheated” market potentially due for a cooldown, while readings below 30 indicate “chilly” conditions that might warm up soon.
Dollar-Cost Averaging can help mitigate risk when DCA strategies indicate uncertain market conditions.
Smart crypto analysts never rely on a single indicator.
Instead, they combine technical analysis with fundamental research—examining white papers, developer teams, and real-world utility—like detectives gathering evidence from multiple sources.
This balanced approach helps separate legitimate projects from the crypto equivalent of snake oil.
Recognizing market cycles can provide crucial context for when to adjust your investment strategy as conditions change.
For newcomers, risk management trumps fancy analysis techniques.
Even the most sophisticated chart reading can’t eliminate cryptocurrency’s inherent volatility.
Setting predefined stop-loss levels (your financial ejection seat) and thoughtful position sizing prevents one bad trade from obliterating your portfolio.
The cryptocurrency market cycles through periods of euphoria and despair with almost predictable regularity.